Analytics

Age Structure Shift in China: Evolving Demographics Over Half a Century

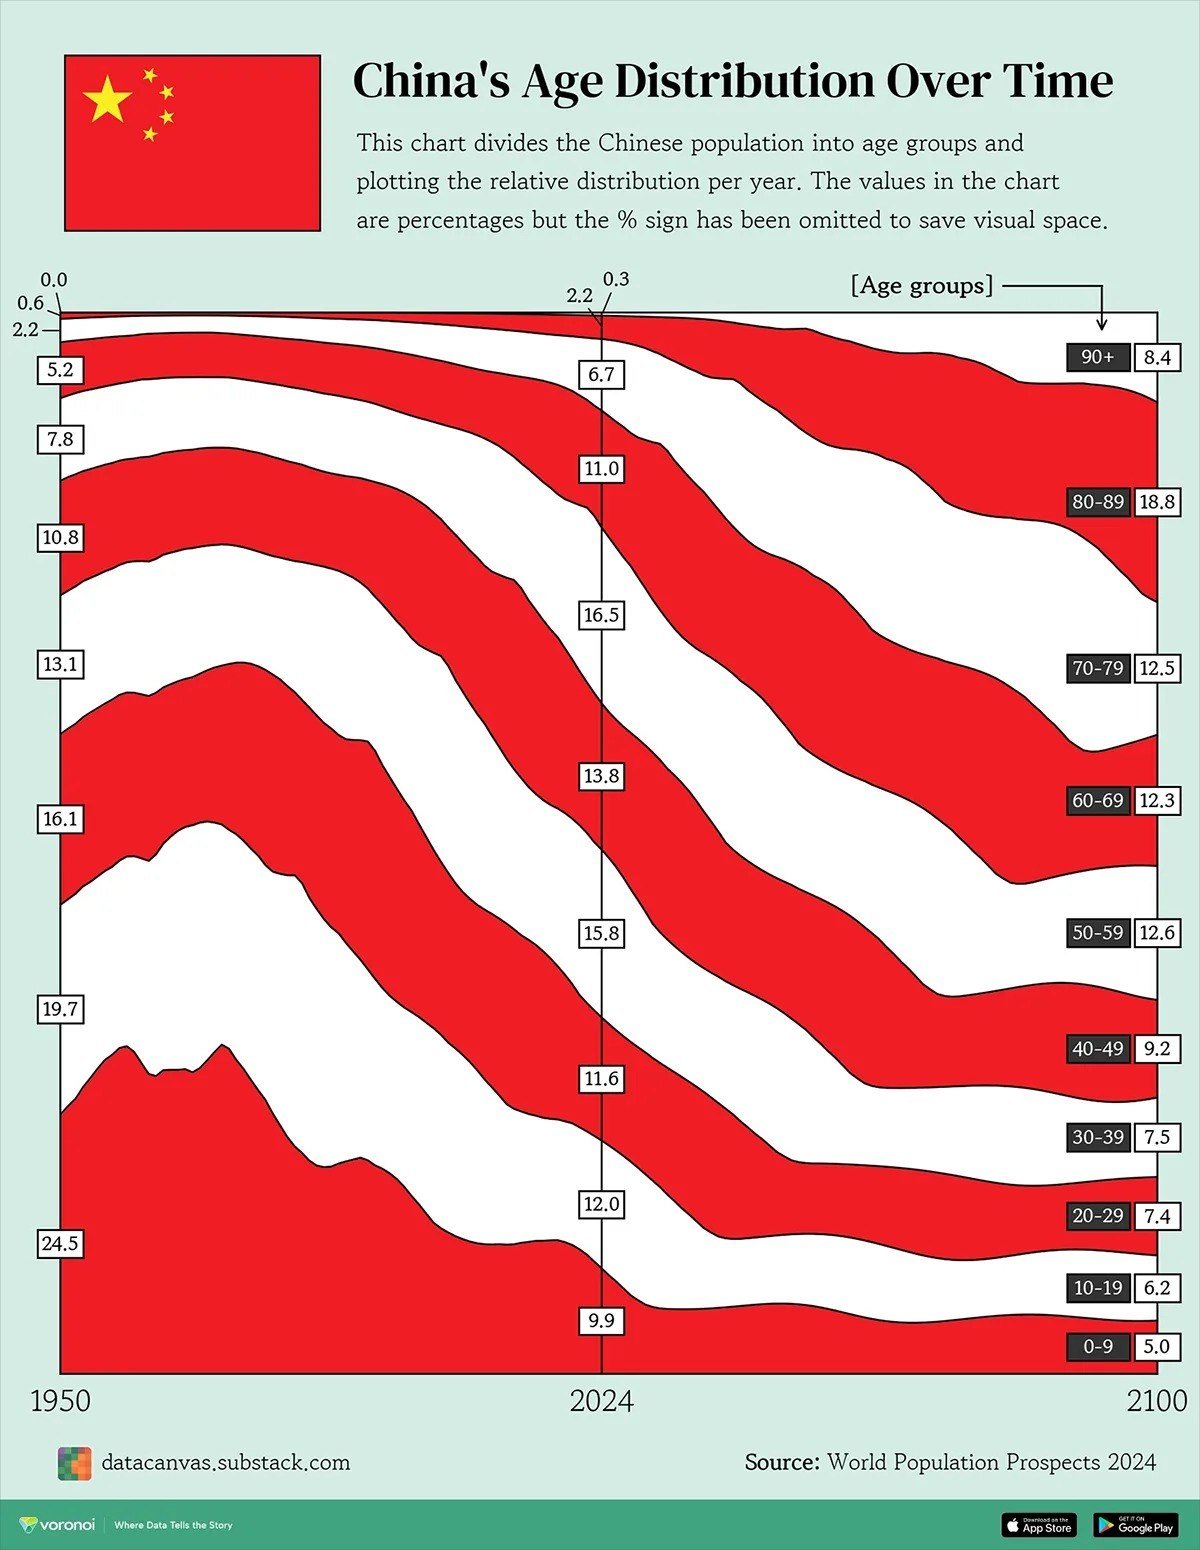
Age Structure Shift in China: Evolving Demographics Over Half a Century In 1950, 0-9-year-olds were the most significant age group in China, making up 24.5% of the population. This percentage occasionally exceeded 25% during the 1950s and 1960s. Fast forward to the present day, where children under 10 now represent only 9.9% of the population. In contrast, individuals aged 50-59 have taken the lead, constituting 16.5% of the population, a substantial increase from the 7.8% recorded in 1950. Looking ahead to 2100, projections suggest that children under 10 will make up a mere 5% of the population. The most prominent demographic group in China by then is anticipated to be individuals aged 80-89, making up a significant 18.8% of the population, a stark contrast to the 2.2% currently and a mere 0.6% in 1950.


Who Pays the Least Taxes in the United States

Who Pays the Least Taxes in the United States In 41 out of 51 states in the USA, the wealthiest 1% of the population currently pay the least taxes (in relative terms)! On the other hand, the poorest 20% pay minimal taxes only in 7 states. That's what we call social justice.


Level of Economic Complexity of Different Countries

Level of Economic Complexity of Different Countries The "complexity of the economy" is determined by the diversity and uniqueness of products manufactured in a country. Among the most complex economies globally are Japan, South Korea, and several European nations, notably Germany. The United States has a slightly lower economic complexity, similar to China and countries in Southern Europe. In comparison, our economy falls around the complexity level of nations in Latin America, being less complex than Brazil but more intricate than Peru. Surprisingly, our economy is even considered "more complex" than that of Australia!


Countries Leading in Geothermal Energy Production

Countries Leading in Geothermal Energy Production The United States tops the list with 3,734 megawatts of capacity. Following closely are Indonesia (2,432 MW), the Philippines (1,937 MW), Turkey (1,726 MW - despite the apparent lack of volcanoes there), and Mexico (941 MW). Despite ranking 15th, our country only generates 50 megawatts of geothermal power, significantly lower than the leading nations by two orders of magnitude.


China's Position as Top Goods Exporter to European Countries

China's Position as Top Goods Exporter to European Countries China stands as the leading goods supplier to the US and Ukraine. The country also exports to Turkey, Serbia, Norway, and Denmark. In Eastern and Central European nations, China typically secures a spot in the top 3 or top 5 exporters. However, in Baltic countries, France, Portugal, and other regions marked in yellow, China fails to make it into the top 5 export partners.


Phosphate Reserves in Different Countries Worldwide

Phosphate Reserves in Different Countries Worldwide Phosphates are essential for producing phosphorus fertilizers, crucial for modern agriculture. The largest phosphate reserves globally are found in Morocco, totaling around 50 billion tons. In comparison, China follows with 3.1 billion tons, and Algeria ranks third with 2.2 billion tons. Other countries with significant phosphate reserves include Egypt, Jordan, the USA, and Australia, each holding slightly over 1 billion tons. These reserves play a vital role in sustaining agricultural production worldwide.


Languages of the Indo-European Family in Global Distribution

Languages of the Indo-European Family in Global Distribution Indo-European languages have a notable presence worldwide, with Romance and Germanic languages collectively dominating regions like the Americas, Australia, and the majority of Europe. Additionally, Slavic languages hold influence over the entire northern expanse of Eurasia. Indian languages are also part of the Indo-European language family, alongside numerous languages spoken in the Middle East.


Global Variances in Feeling Loved

Global Variances in Feeling Loved People in Central Asia (including Mongolia) and Morocco report feeling the least loved. Conversely, residents of the CIS countries express love slightly more frequently, though still relatively infrequently, with around 50% of respondents indicating so. On the other hand, Hungary and both Americas stand out with a significant portion of their populations stating that they feel loved.


Average GDP Growth Rates of Different Countries in the World from 2013-2025

Average GDP Growth Rates of Different Countries in the World from 2013-2025 On average over these 12 years, our real GDP increased by 1.5% per year - quite a European level! In Germany, this indicator is an average of 0.9% per year, in France - 1.1%. However, the GDP (per capita) there was noticeably higher in 2013 (and remains so now) than ours... Yet we are far behind, for example, compared to India (average +6.2% per year) and China (+5.9% per year), or even more so to Guyana with its average of +18.3% per year over 12 years (an increase almost 8 times during the period)! The main laggards are Venezuela (averaging -8% per year over 12 years...), both Sudans, Yemen, Ukraine, and Afghanistan.


Where GPS is "Blocked" in the World

Where GPS is "Blocked" in the World On the map, navigation quality assessments from aircraft show areas where GPS functions properly in green, while disruptions are indicated by yellow-orange-red colors. Regions where non-internationally registered aircraft do not operate are left blank. Despite these areas, the map reveals intriguing patterns. Significant global GPS blocking zones include the borders of western Russia, areas surrounding Ukraine (especially near its western borders), and the northern part of the Black Sea, where both conflicting sides likely block GPS signals. Navigation poses challenges in the Middle East, particularly around Israel and Iran. GPS issues are also present in Southeast Asia (near Myanmar), isolated locations in Africa, and sporadically in Latin America.